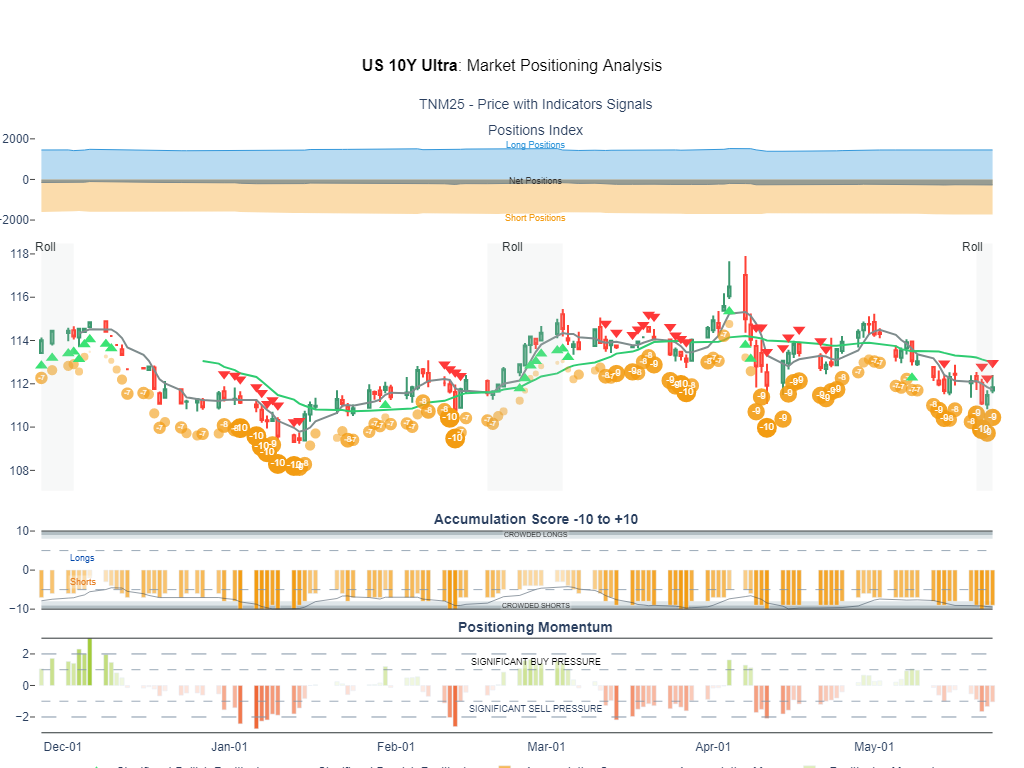
- Net short positions in 10Y Ultra Futures have increased 13% since the beginning of the month.
- The Position Accumulation Score has hit a -10 Short, signaling elevated crowding risk.
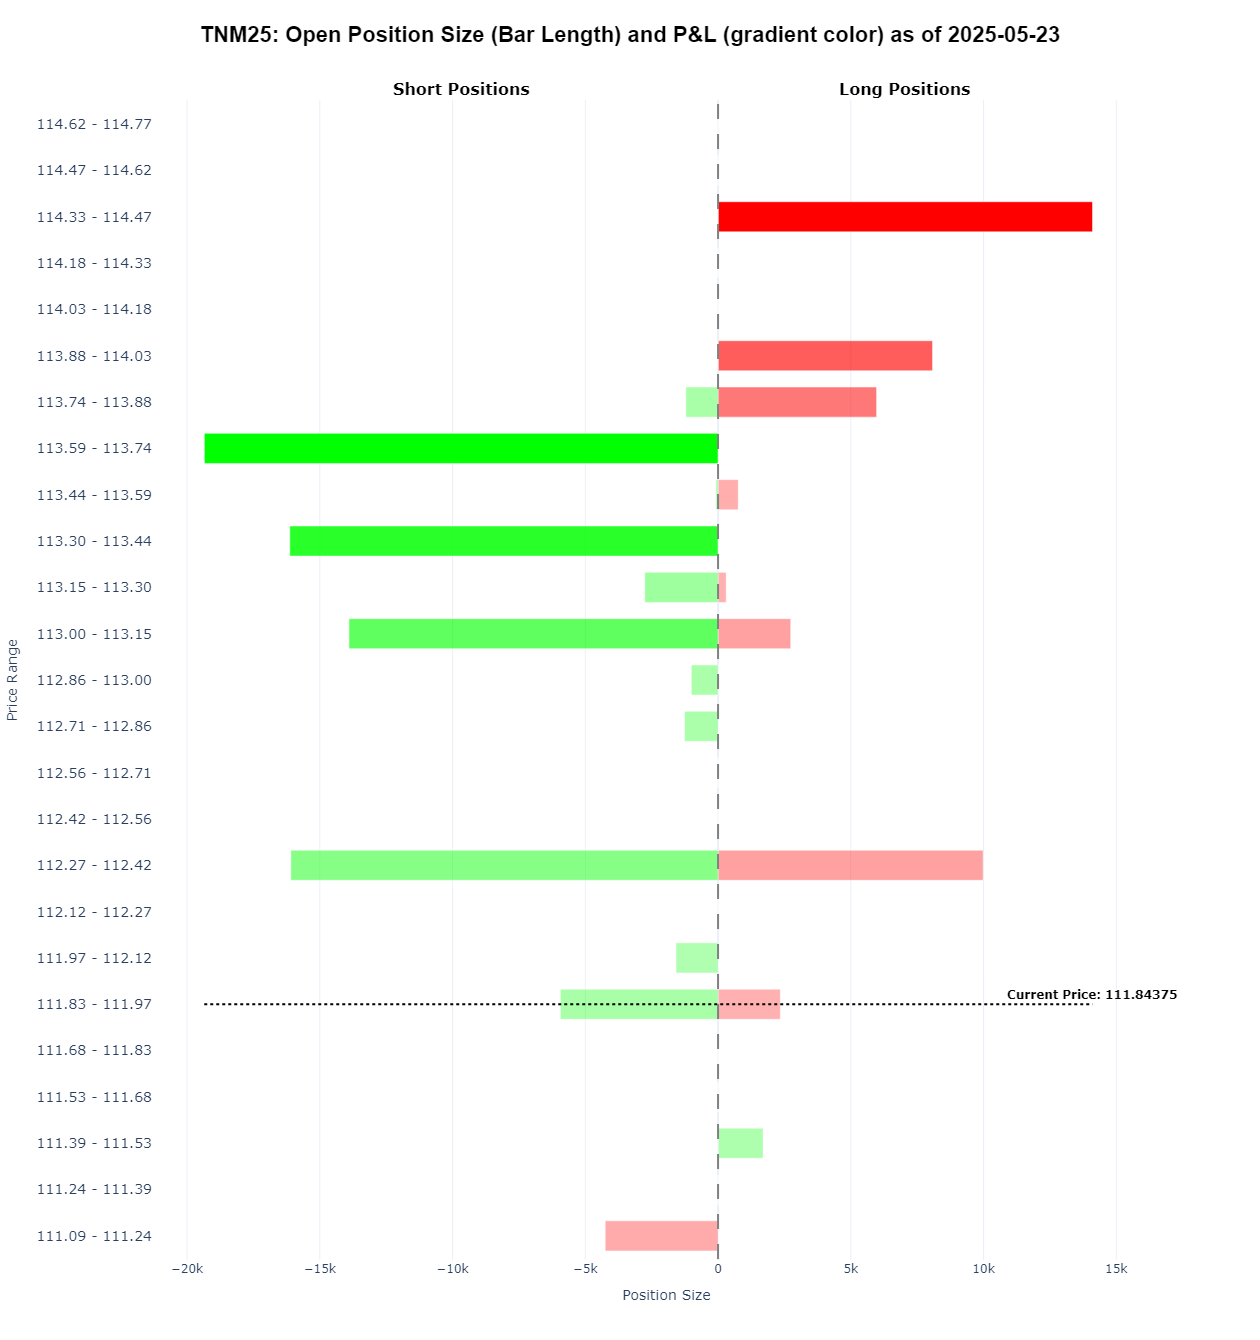
- A key concentration of short positions sits between 112-09 and 112-13, where a break higher could trigger a broader squeeze toward upper levels
As U.S. interest rates approach critical thresholds, this article examines current positioning in U.S. Treasury futures markets. We assess the momentum behind recent flows, pinpoint the price levels where the largest concentrations of open interest are located, and compare them against historical benchmarks to uncover potential reversal signals.
Since the beginning of May, net short positions in the 10-Year Ultra Treasury Futures have grown by approximately 13%, reflecting a marked acceleration in short duration allocation. This shift comes as market participants increasingly focus on U.S. fiscal policy risks, including concerns over the expanding deficit and the Treasury’s aggressive issuance schedule, both of which are putting upward pressure on yields.
Positioning Concentration and Reversal Risk
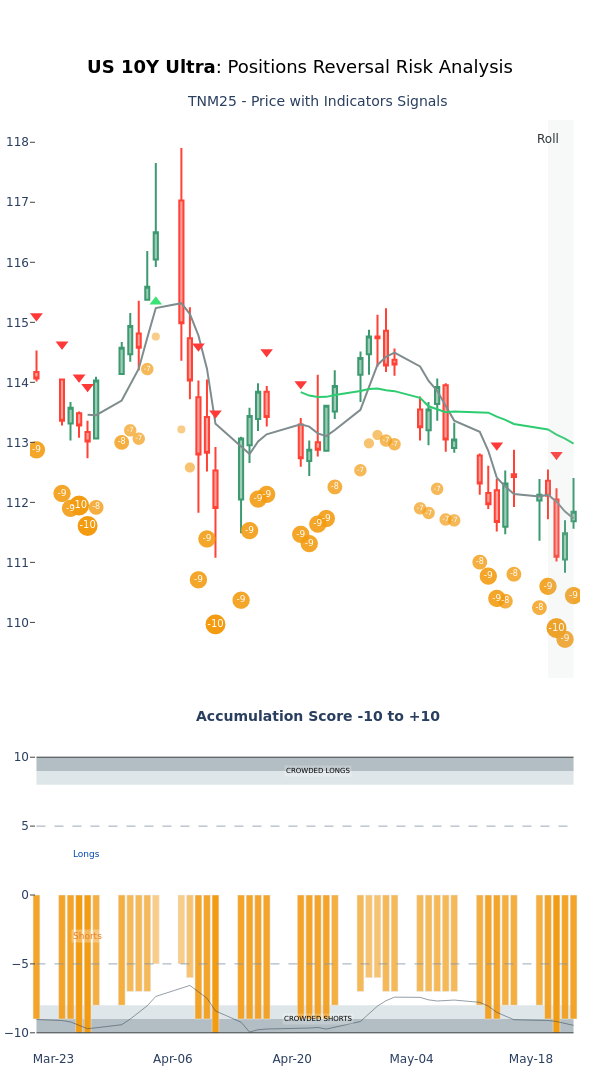
Short positioning has now reached an extreme level, with the Positions Accumulation Score hitting -10, the lowest reading on its scale, which ranges from -10 (indicating short concentration) to +10 (long concentration). This metric captures the buildup of directional positions and acts as a proxy for crowding risk.
Since the start of the year, this is the fifth instance of a -10 reading. In each of the previous four cases (see chart below), the market experienced a sharp rebound once short momentum began to fade. This highlights a crucial nuance: while extreme positioning suggests elevated reversal risk, timing such reversals effectively requires signs that momentum is beginning to stall.

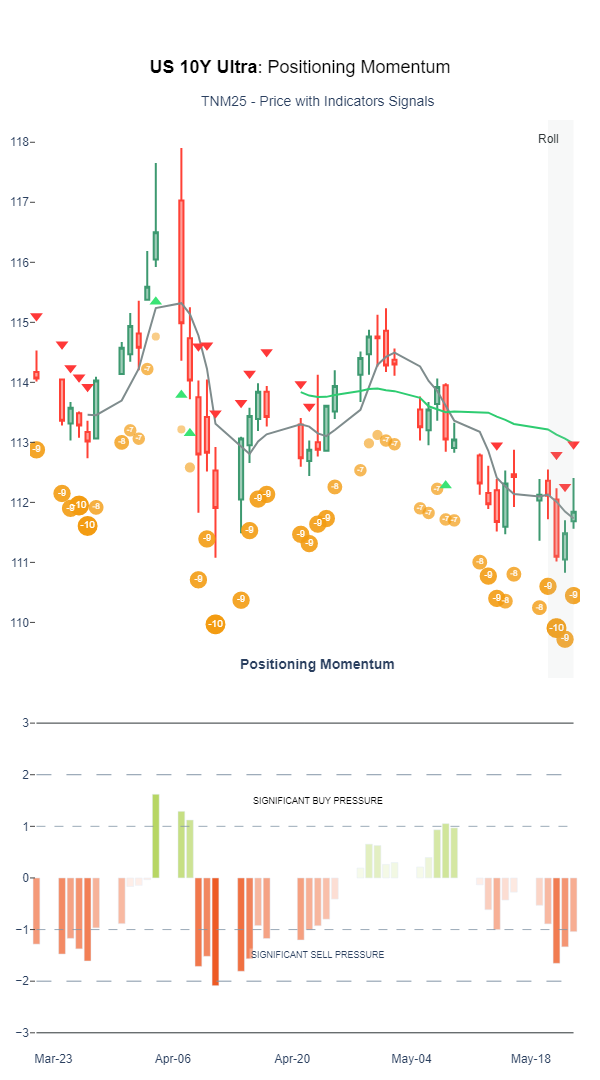
The Positioning Momentum Score tracks the strength and velocity of directional flows. Short positioning momentum surged last Wednesday, coinciding with the auction of the 20-Year U.S. Treasury bond. This indicates that bearish momentum is currently significant and reinforces the need for caution when attempting to fade the move prematurely.
We are therefore closely monitoring any developments that could trigger or force a reversal in positions. The chart below provides a breakdown of how positions are distributed according to our model.
Key Positions Levels

One of the most important elements to watch is where large clusters of short positions are concentrated.
In the 10-Year Ultra Treasury Future, a close above the 112-13 to 112-16 range, where approximately 16,000 short contracts are positioned, could act as a technical catalyst.
A breach of this zone may prompt covering flows, potentially accelerating a move toward higher levels, with the next key concentration area sitting above 113-10.
Conclusion: Reversal Risk Building, but Triggers Needed
Positioning in the 10-Year Ultra Futures is now deeply skewed to the short side, with the Accumulation Score at -10 signalling short positions crowding. At the same time, the Positioning Momentum Score reflects sustained bearish pressure, suggesting that while the risk of a reversal is rising, it is not necessarily imminent.
We have identified key clusters of short positions that could act as triggers for a move higher. The next few sessions will be critical: any dovish signals from policymakers, softer macro data, or adjustments in fiscal or issuance dynamics could prompt a meaningful unwind in positioning.
Until such catalysts emerge, bearish momentum remains in control, and fading the move prematurely — without clear confirmation of reversal — remains a high-risk strategy.

Accumulation Score at -10: prior readings this year preceded sharp rebounds.

Momentum Score highlights sustained short-side pressure post-auction
